


Project Overview
The AI Tea Farm Monitoring System was my university graduation project, integrating drone image analysis, artificial intelligence, tea leaf disease detection, and a mobile application to help tea farmers monitor and manage their tea farms.
We visited Shiding District, New Taipei City multiple times to conduct field research, visiting four tea farms and interviewing local tea farmers to understand the challenges they faced in large-scale farm inspection, labor shortages, tea plant growth conditions, disease detection, and daily management.
Based on the interviews and field observations, we combined drone photography, image analysis, artificial intelligence, and a mobile application, allowing tea farmers to view tea farm images and growth analysis results from different periods on their phones, perform tea leaf disease detection, receive management recommendations, and track disease distribution. The system was designed to bring together tea farm information that was previously scattered and required substantial manual work, helping tea farmers monitor farm conditions more conveniently.
The tea farm names used in this project are for demonstration purposes only and are not the actual names of the farms. All four tea farms were photographed in Shiding.
Related Competition Experience
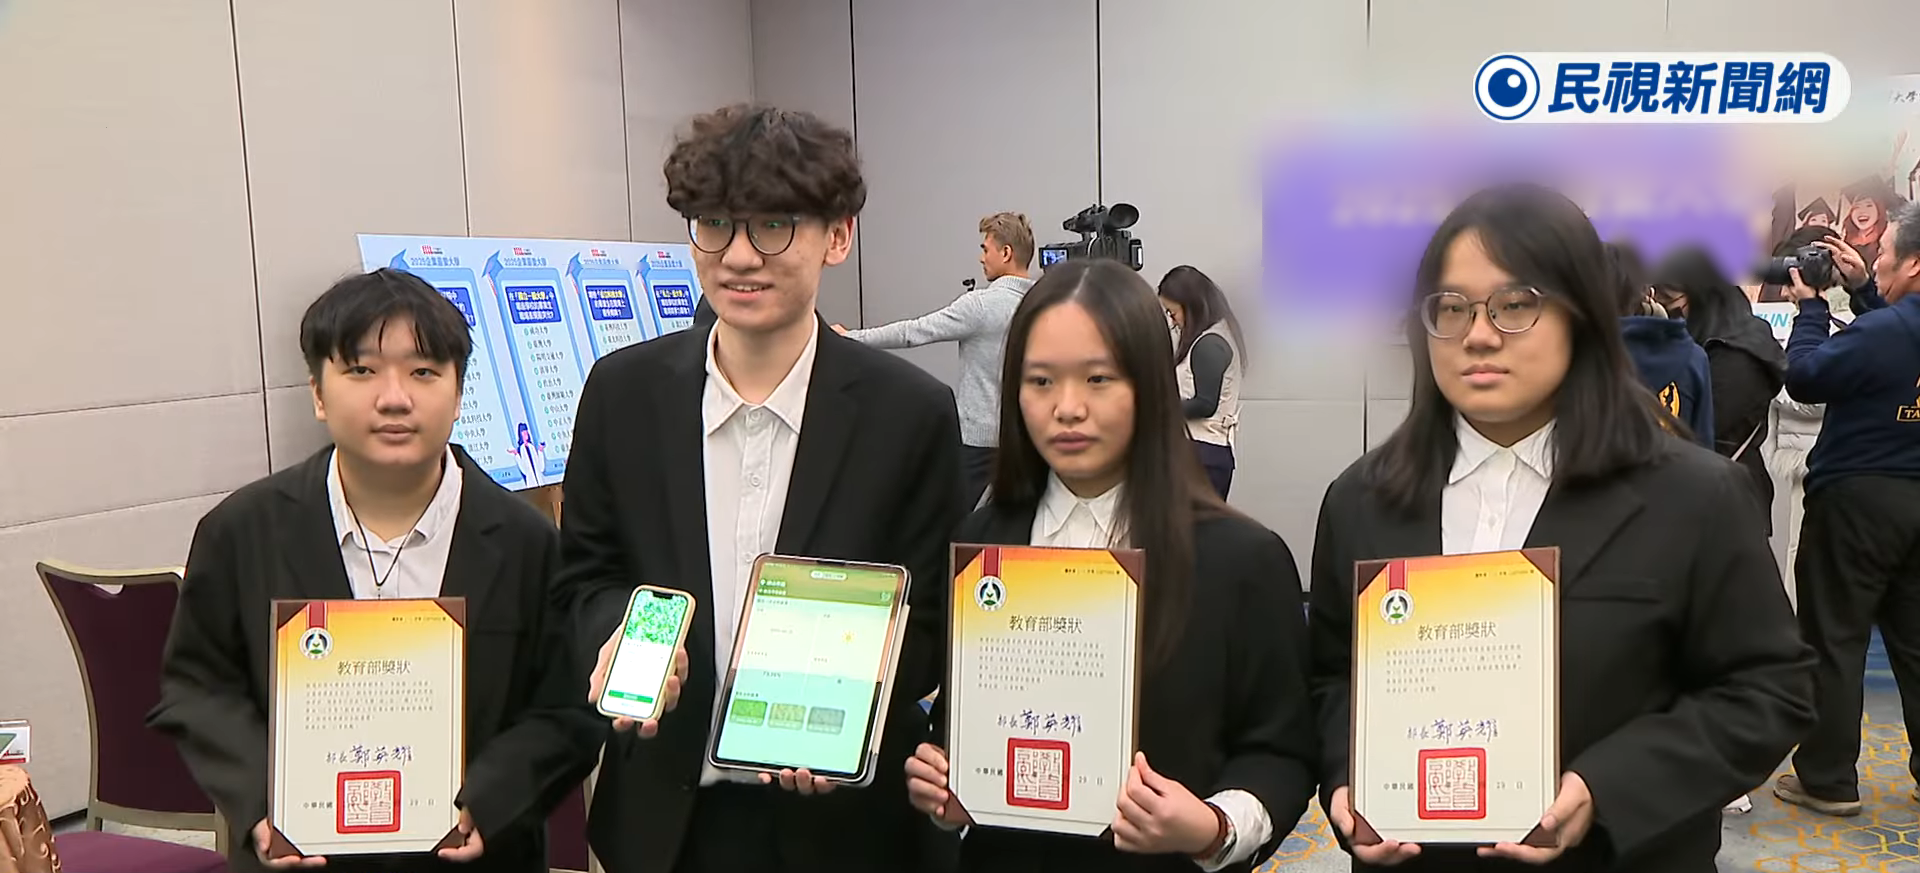
This project participated in two competitions organized by Taiwan’s Ministry of Education and received First Place in both.
- Ministry of Education’s 2025 National Technical and Vocational College Student Practical Project Competition and Exhibition | First Place in the Biotechnology, Medicine, and Agriculture Category
- Ministry of Education’s Humanities and Social Sustainability Action Innovation Application Competition | General Category Excellence Award (1st Place)
Related News Coverage
- AI Recognition Helps Monitor Tea Farm Diseases, Chihlee University of Technology Team Wins Project Competition Award
- Ministry of Education Press Release - 2025 National Technical and Vocational College Student Practical Project Competition and Exhibition Results Announced
- Shiding High School and Chihlee University of Technology Students Use Drones and AI to Help Tea Farmers, Winning the Ministry of Education’s Inaugural Sustainability Action Innovation Award
- Humanities and Social Sustainability Action Innovation Application Competition Highlights Interdisciplinary Social Engagement
Features
Tea Farm Conditions and Images
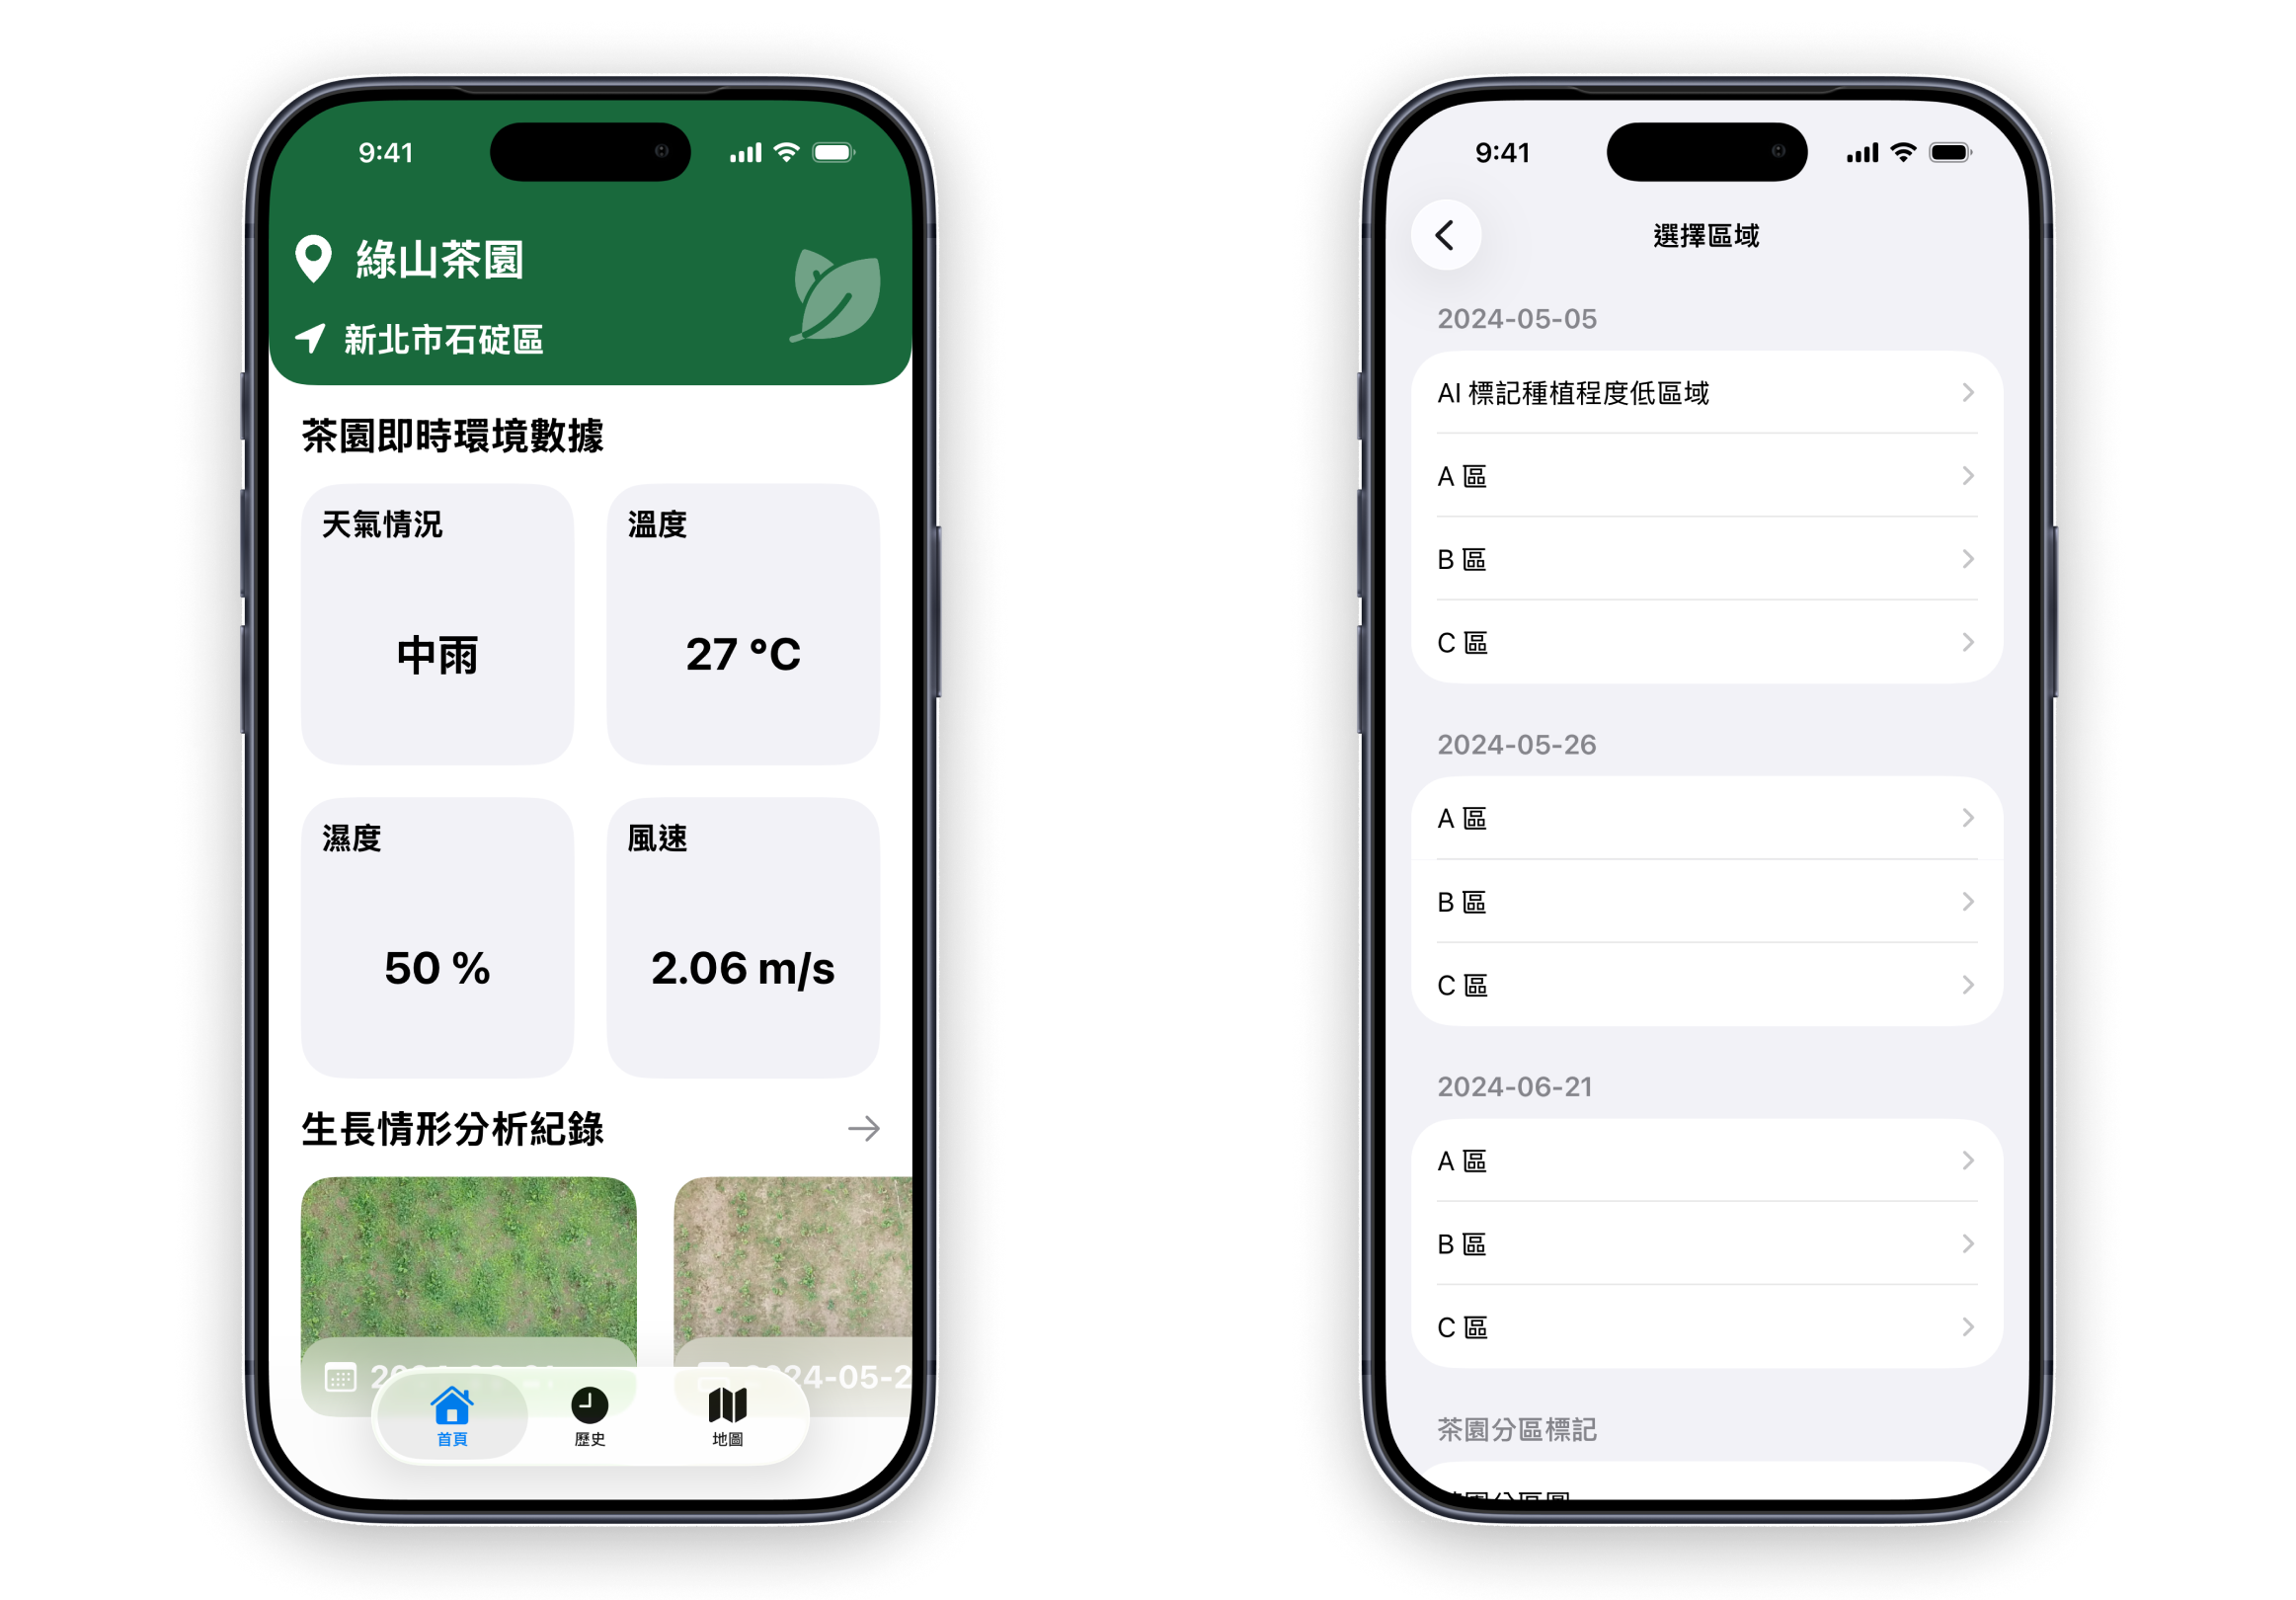
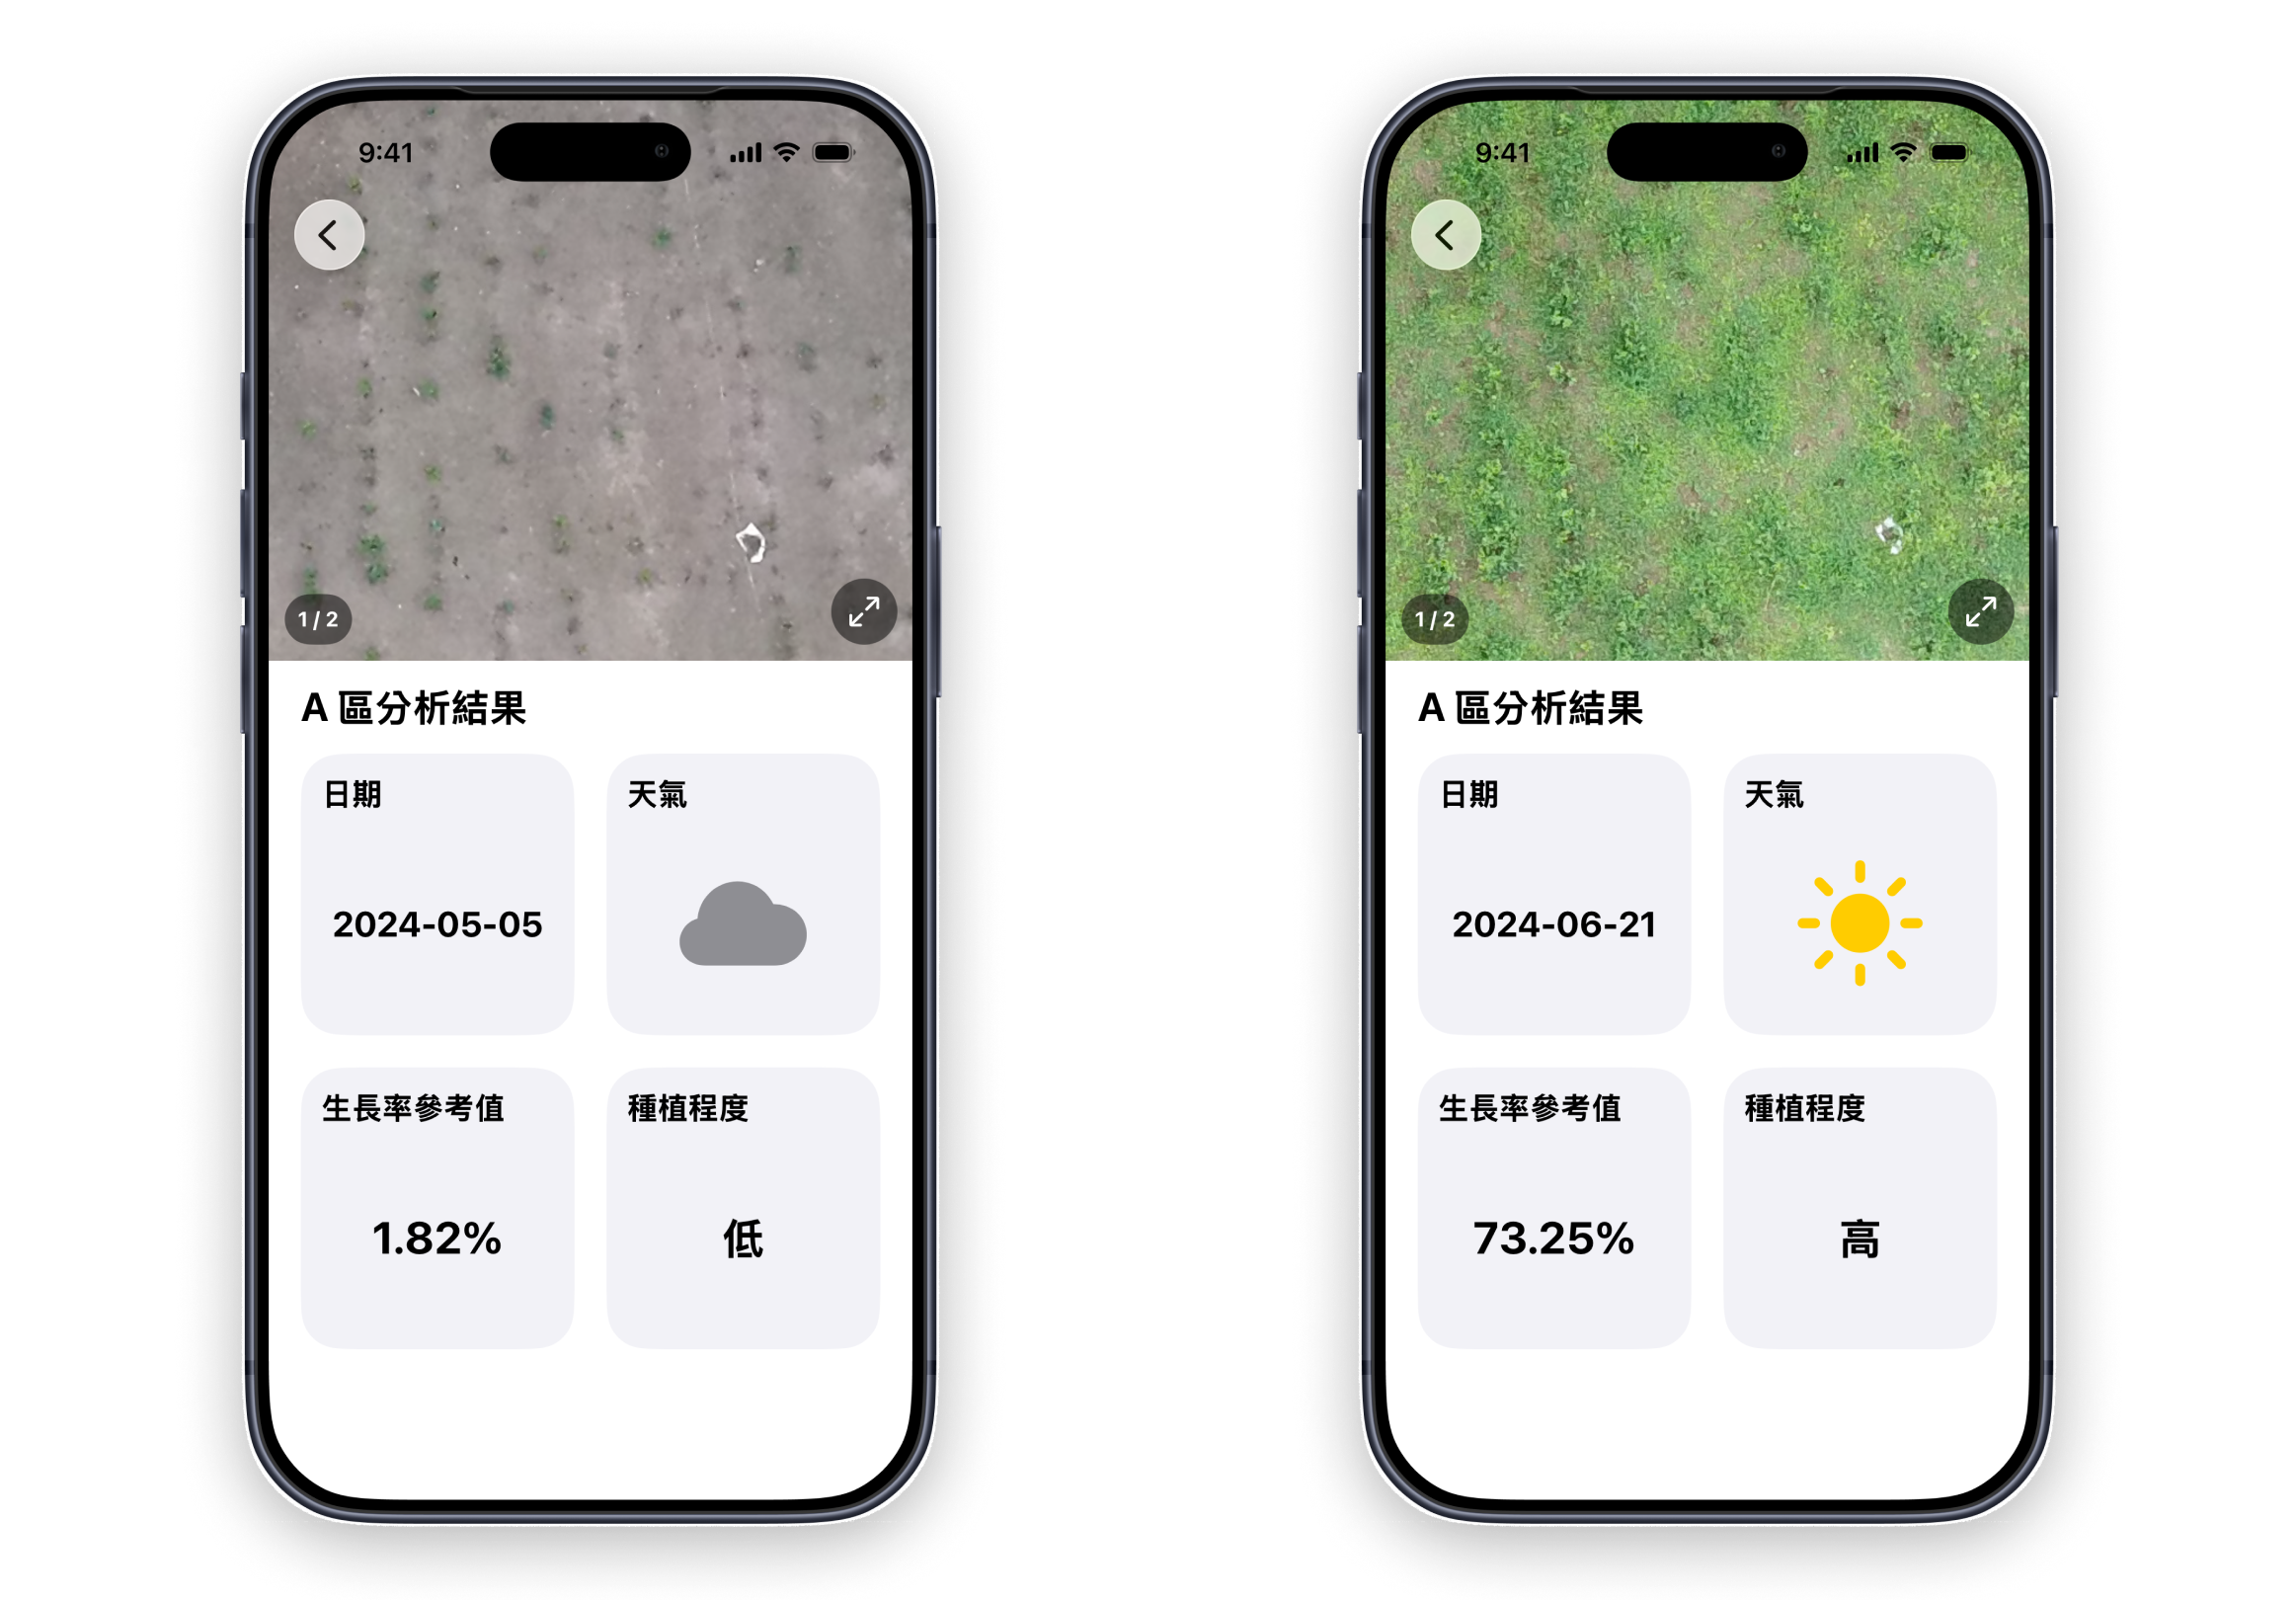
Tea farmers can view historical monitoring records for their tea farms, including drone images of the tea farms, capture dates, growth rate reference values, planting levels, and other information. Records from different periods allow farmers to continuously observe growth changes in the same tea farm without relying solely on manual inspections at a single point in time.
Tea Farm Image Analysis
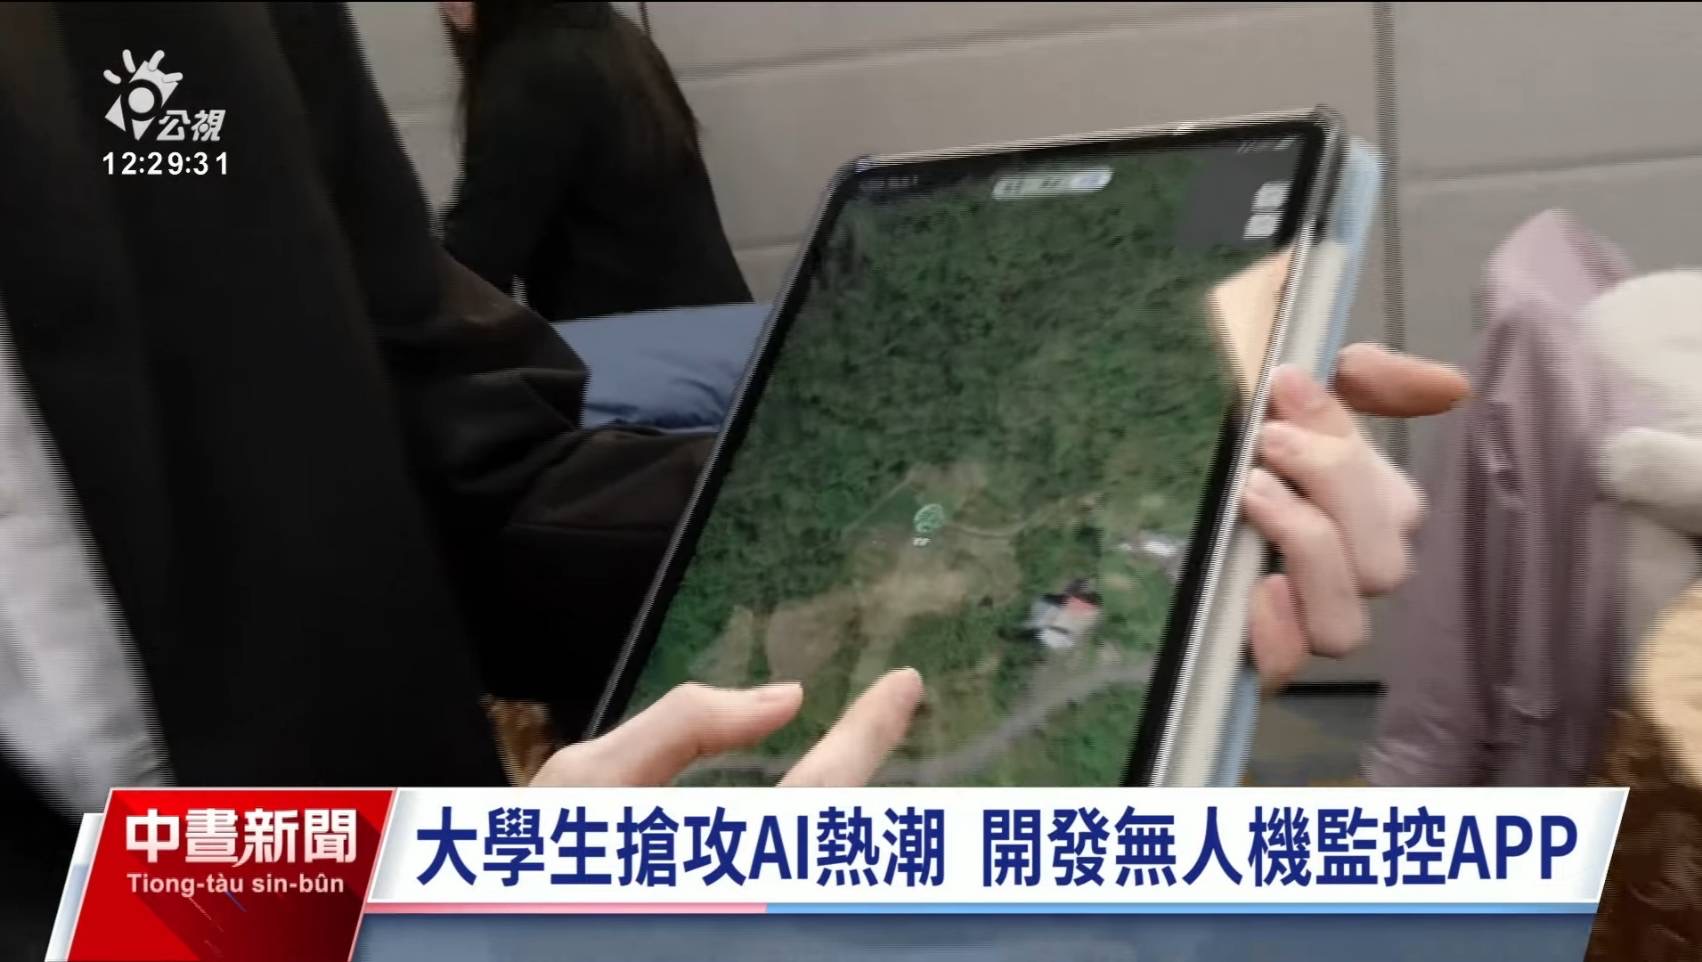
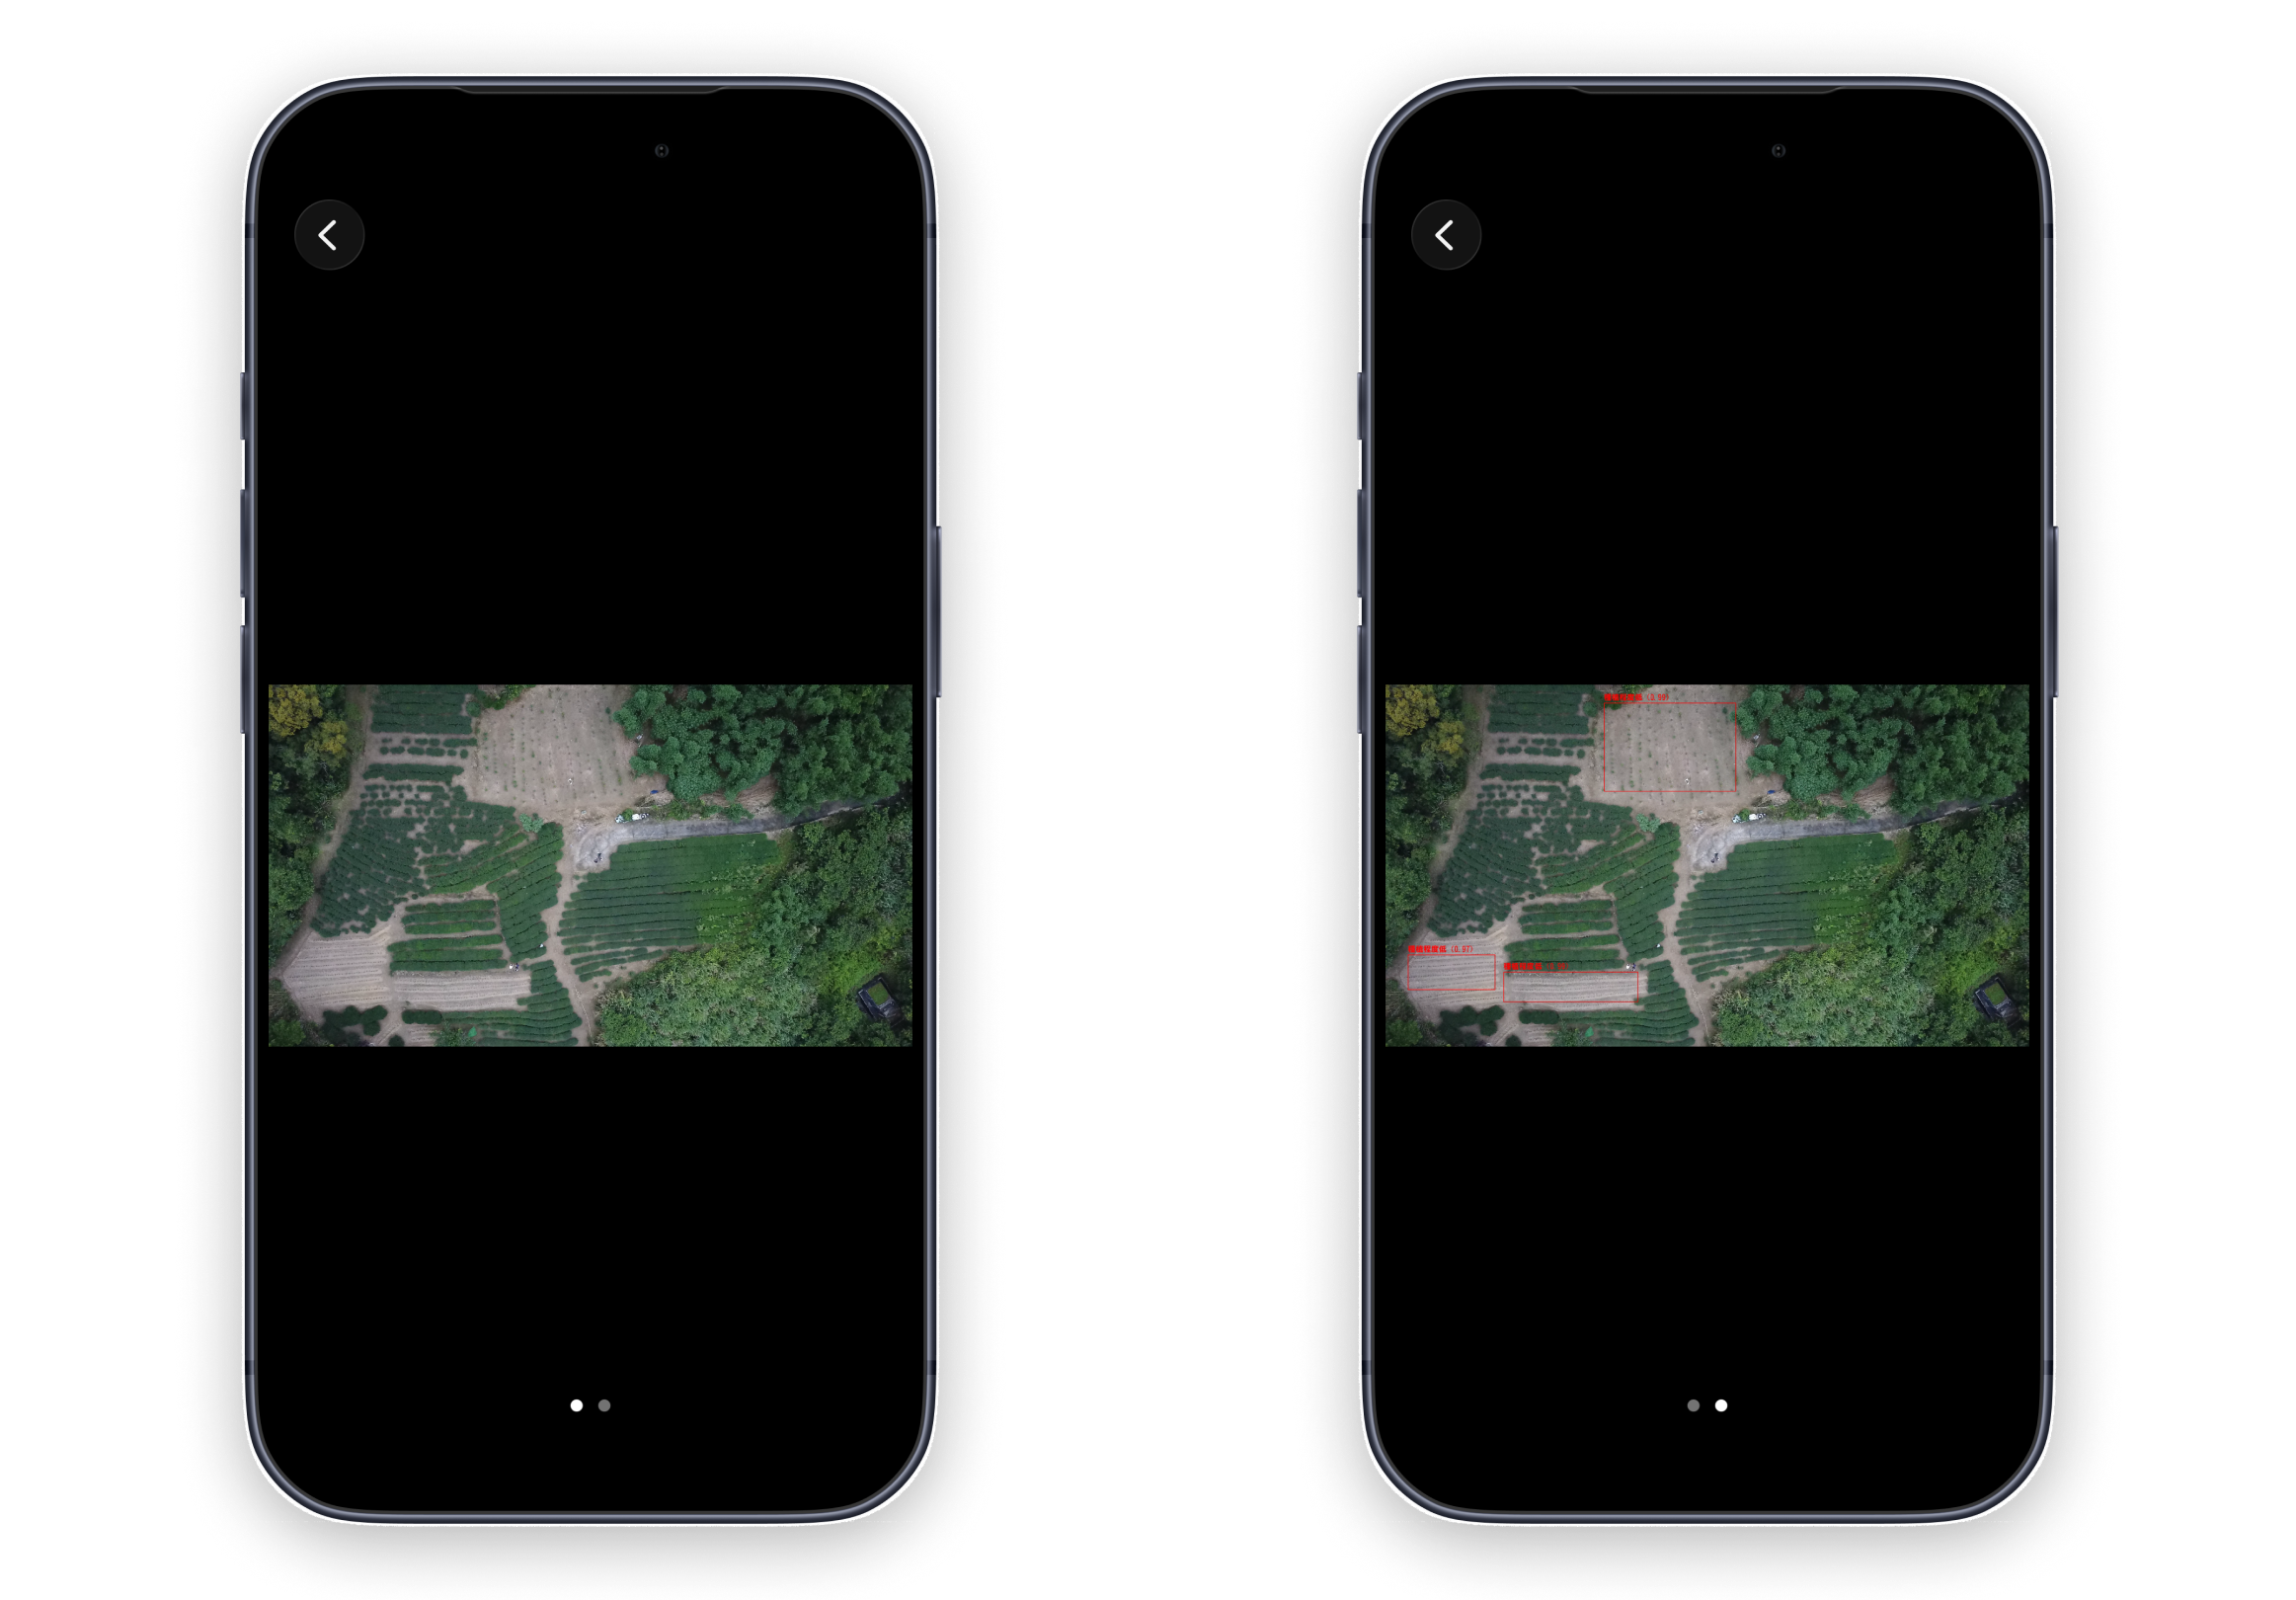
After drone images are captured, the system presents image analysis results in the App using an artificial intelligence model to identify areas with lower planting levels that may require attention. In addition to viewing the analyzed images, tea farmers can review the results alongside the original aerial images and previous records, helping them identify changes across large tea farms that may be difficult to detect through manual inspection.
Tea Leaf Disease Detection and History
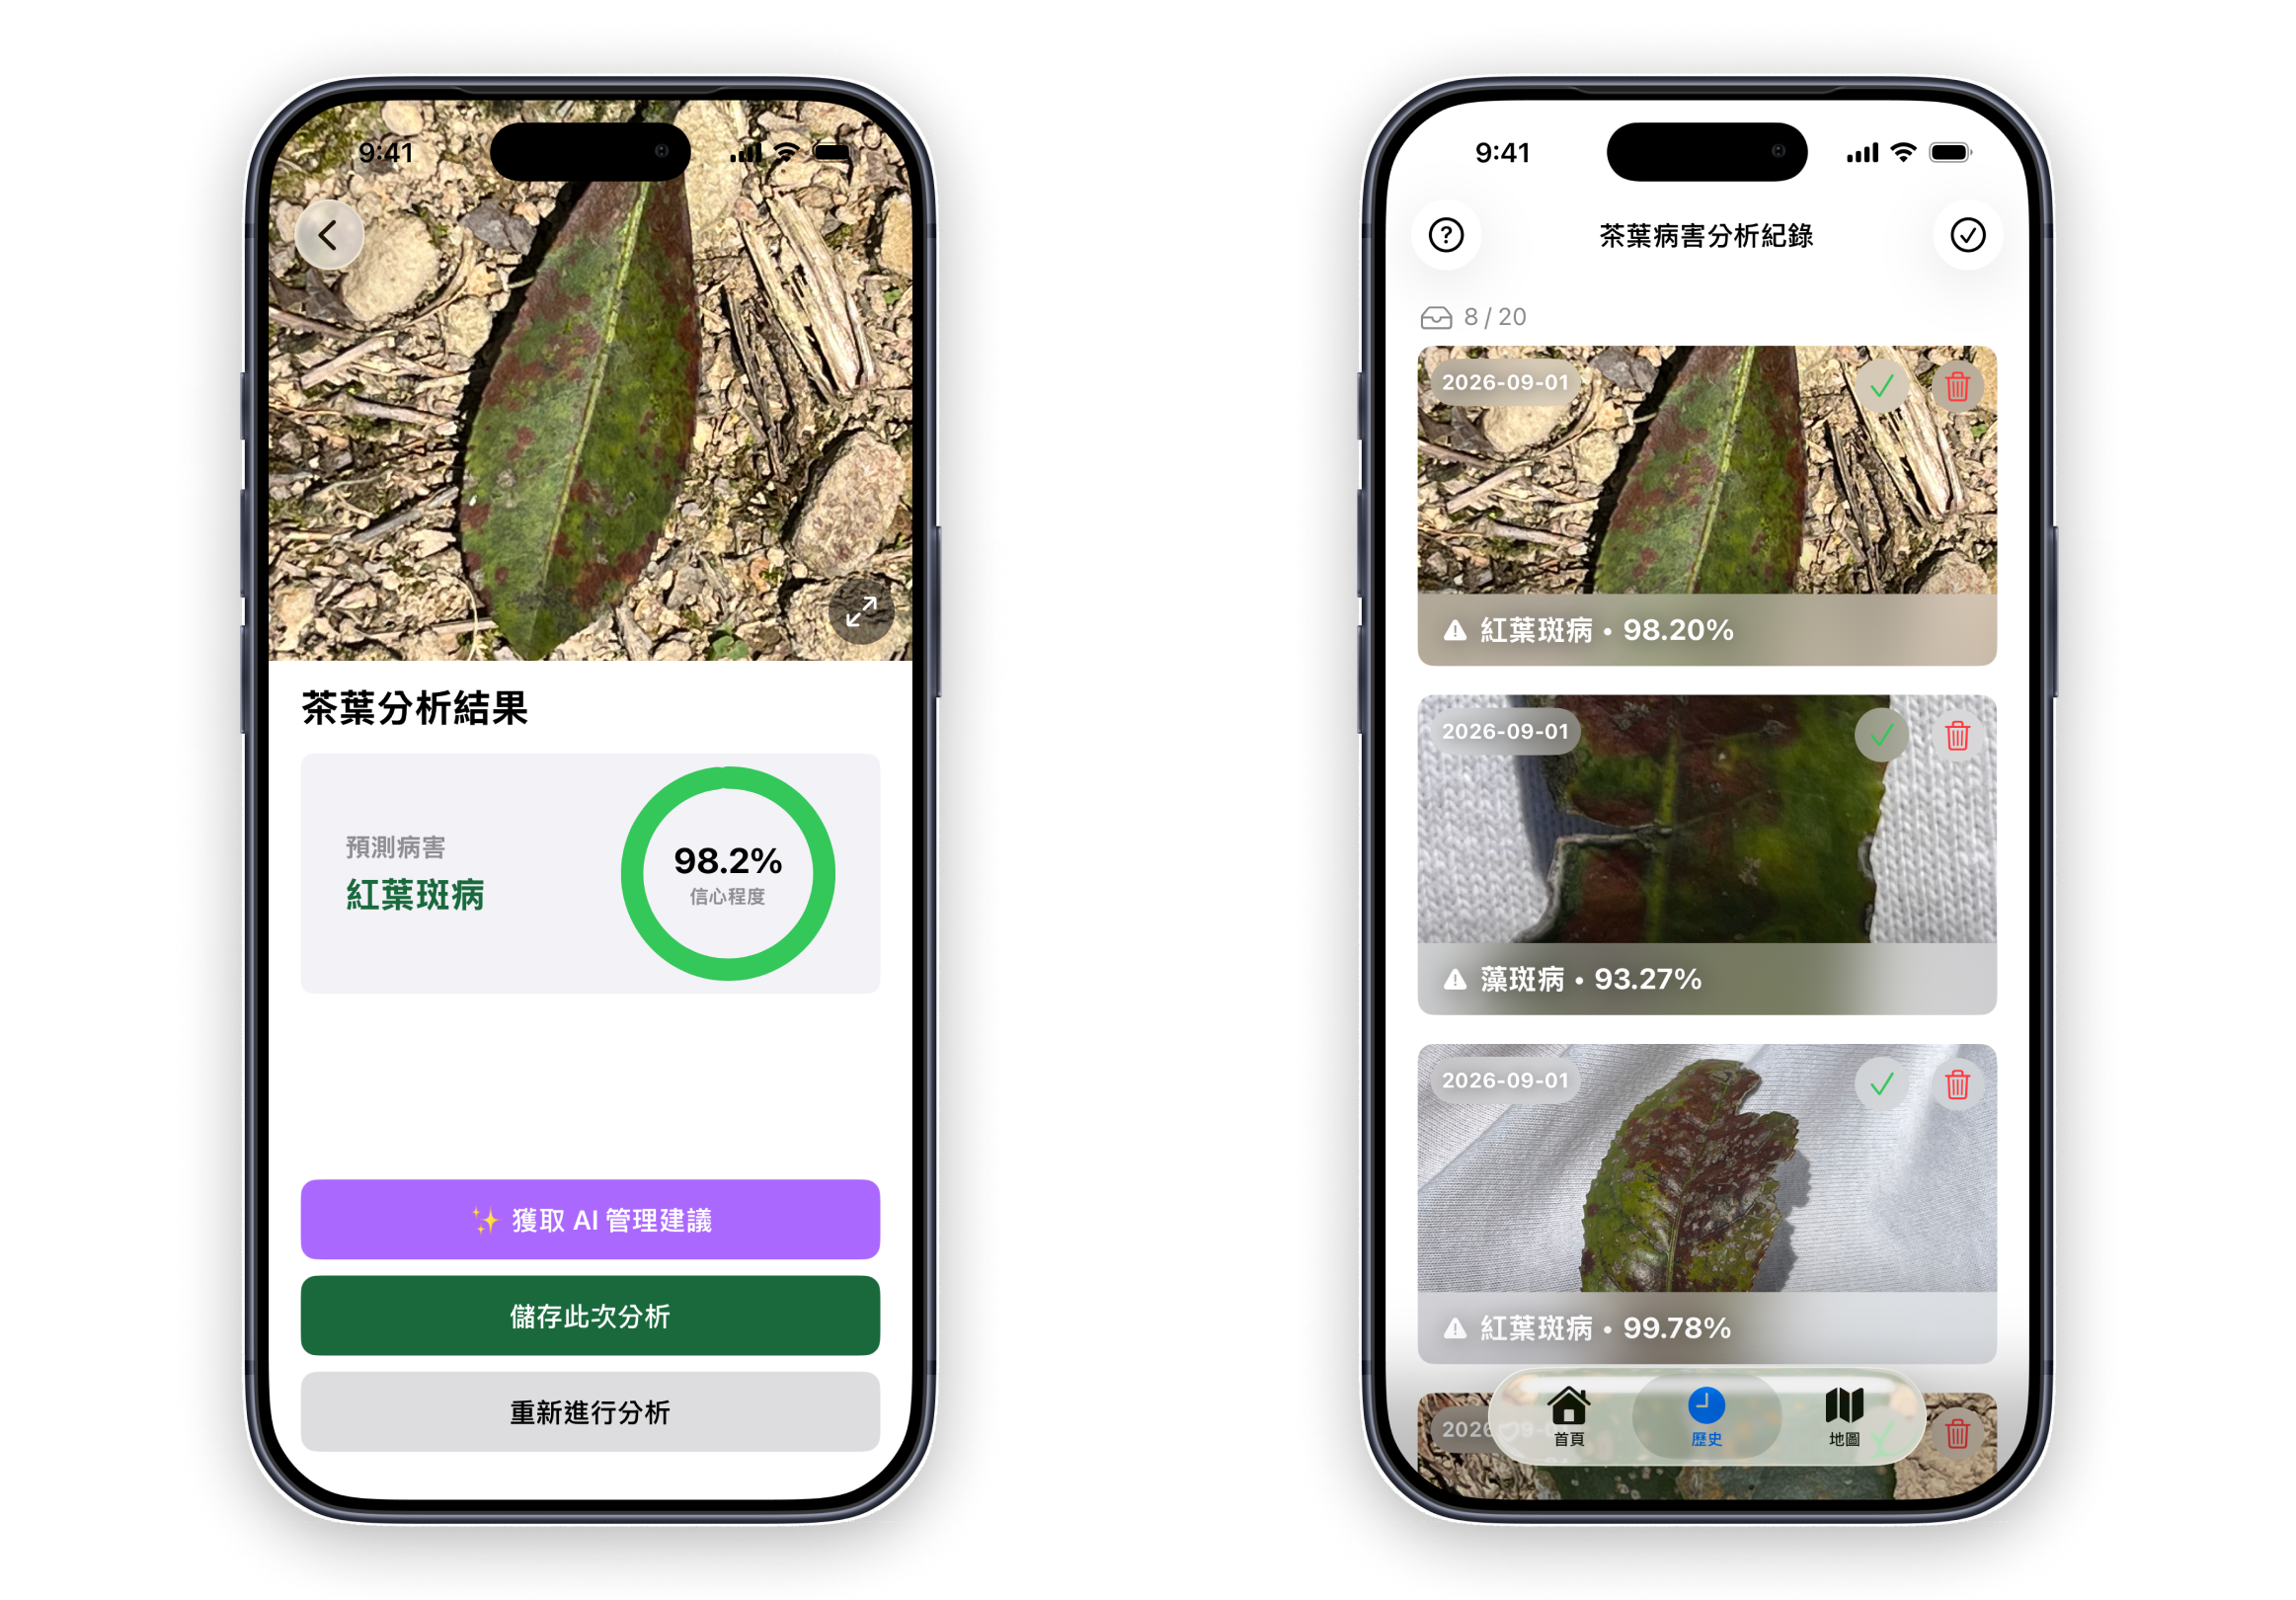
Tea farmers can take photos of tea leaves directly with their phones or select existing photos from their photo library for disease detection. The system uses an open-source tea leaf disease detection model to directly determine the condition of the tea leaf, including healthy conditions or different types of disease, and displays the result and confidence level to help tea farmers quickly understand the condition of the leaf.
After detection, tea farmers can choose to save the analysis result and later review the tea leaf photo, disease type, confidence level, and related information. By continuously accumulating records, tea farmers can review previously detected diseases and analysis results.
AI Management Recommendations
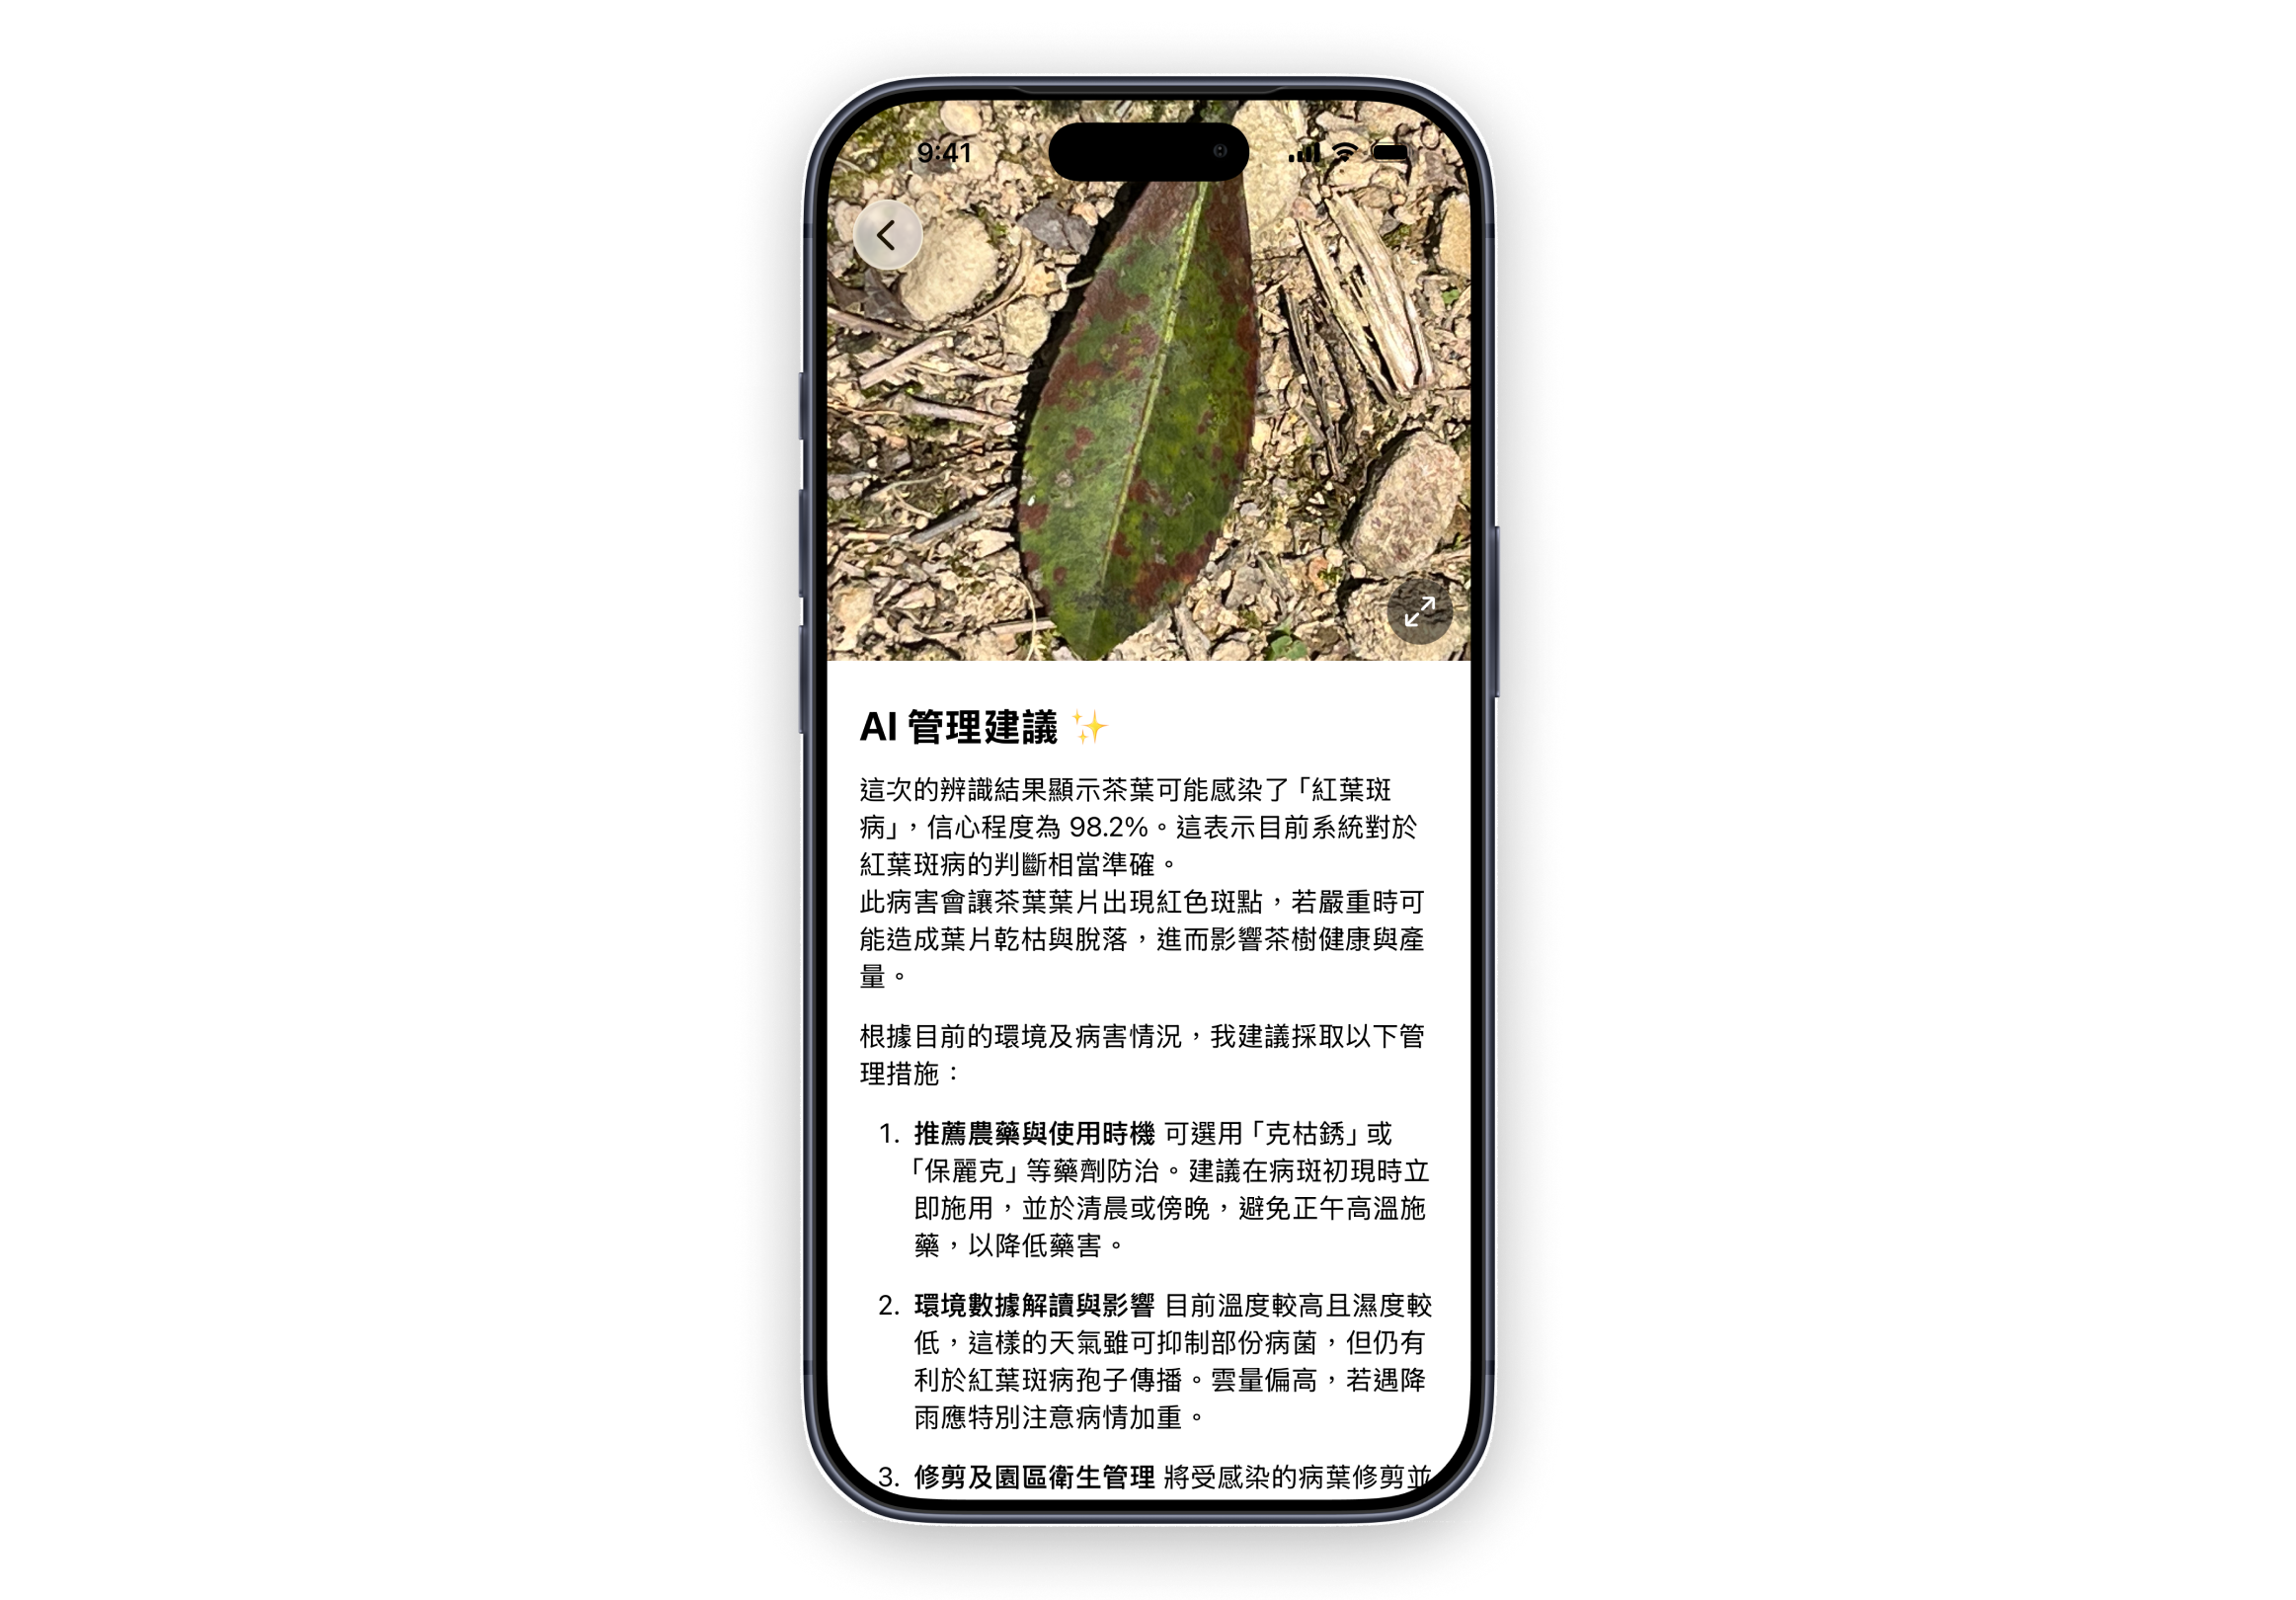
After disease detection, the system combines the disease type, detection result, and current weather information, using the OpenAI GPT API to organize the relevant information into easier-to-understand explanations and tea farm management recommendations. In addition to learning which disease may be present, tea farmers can also understand possible directions for handling it.
Disease Map and Heatmap
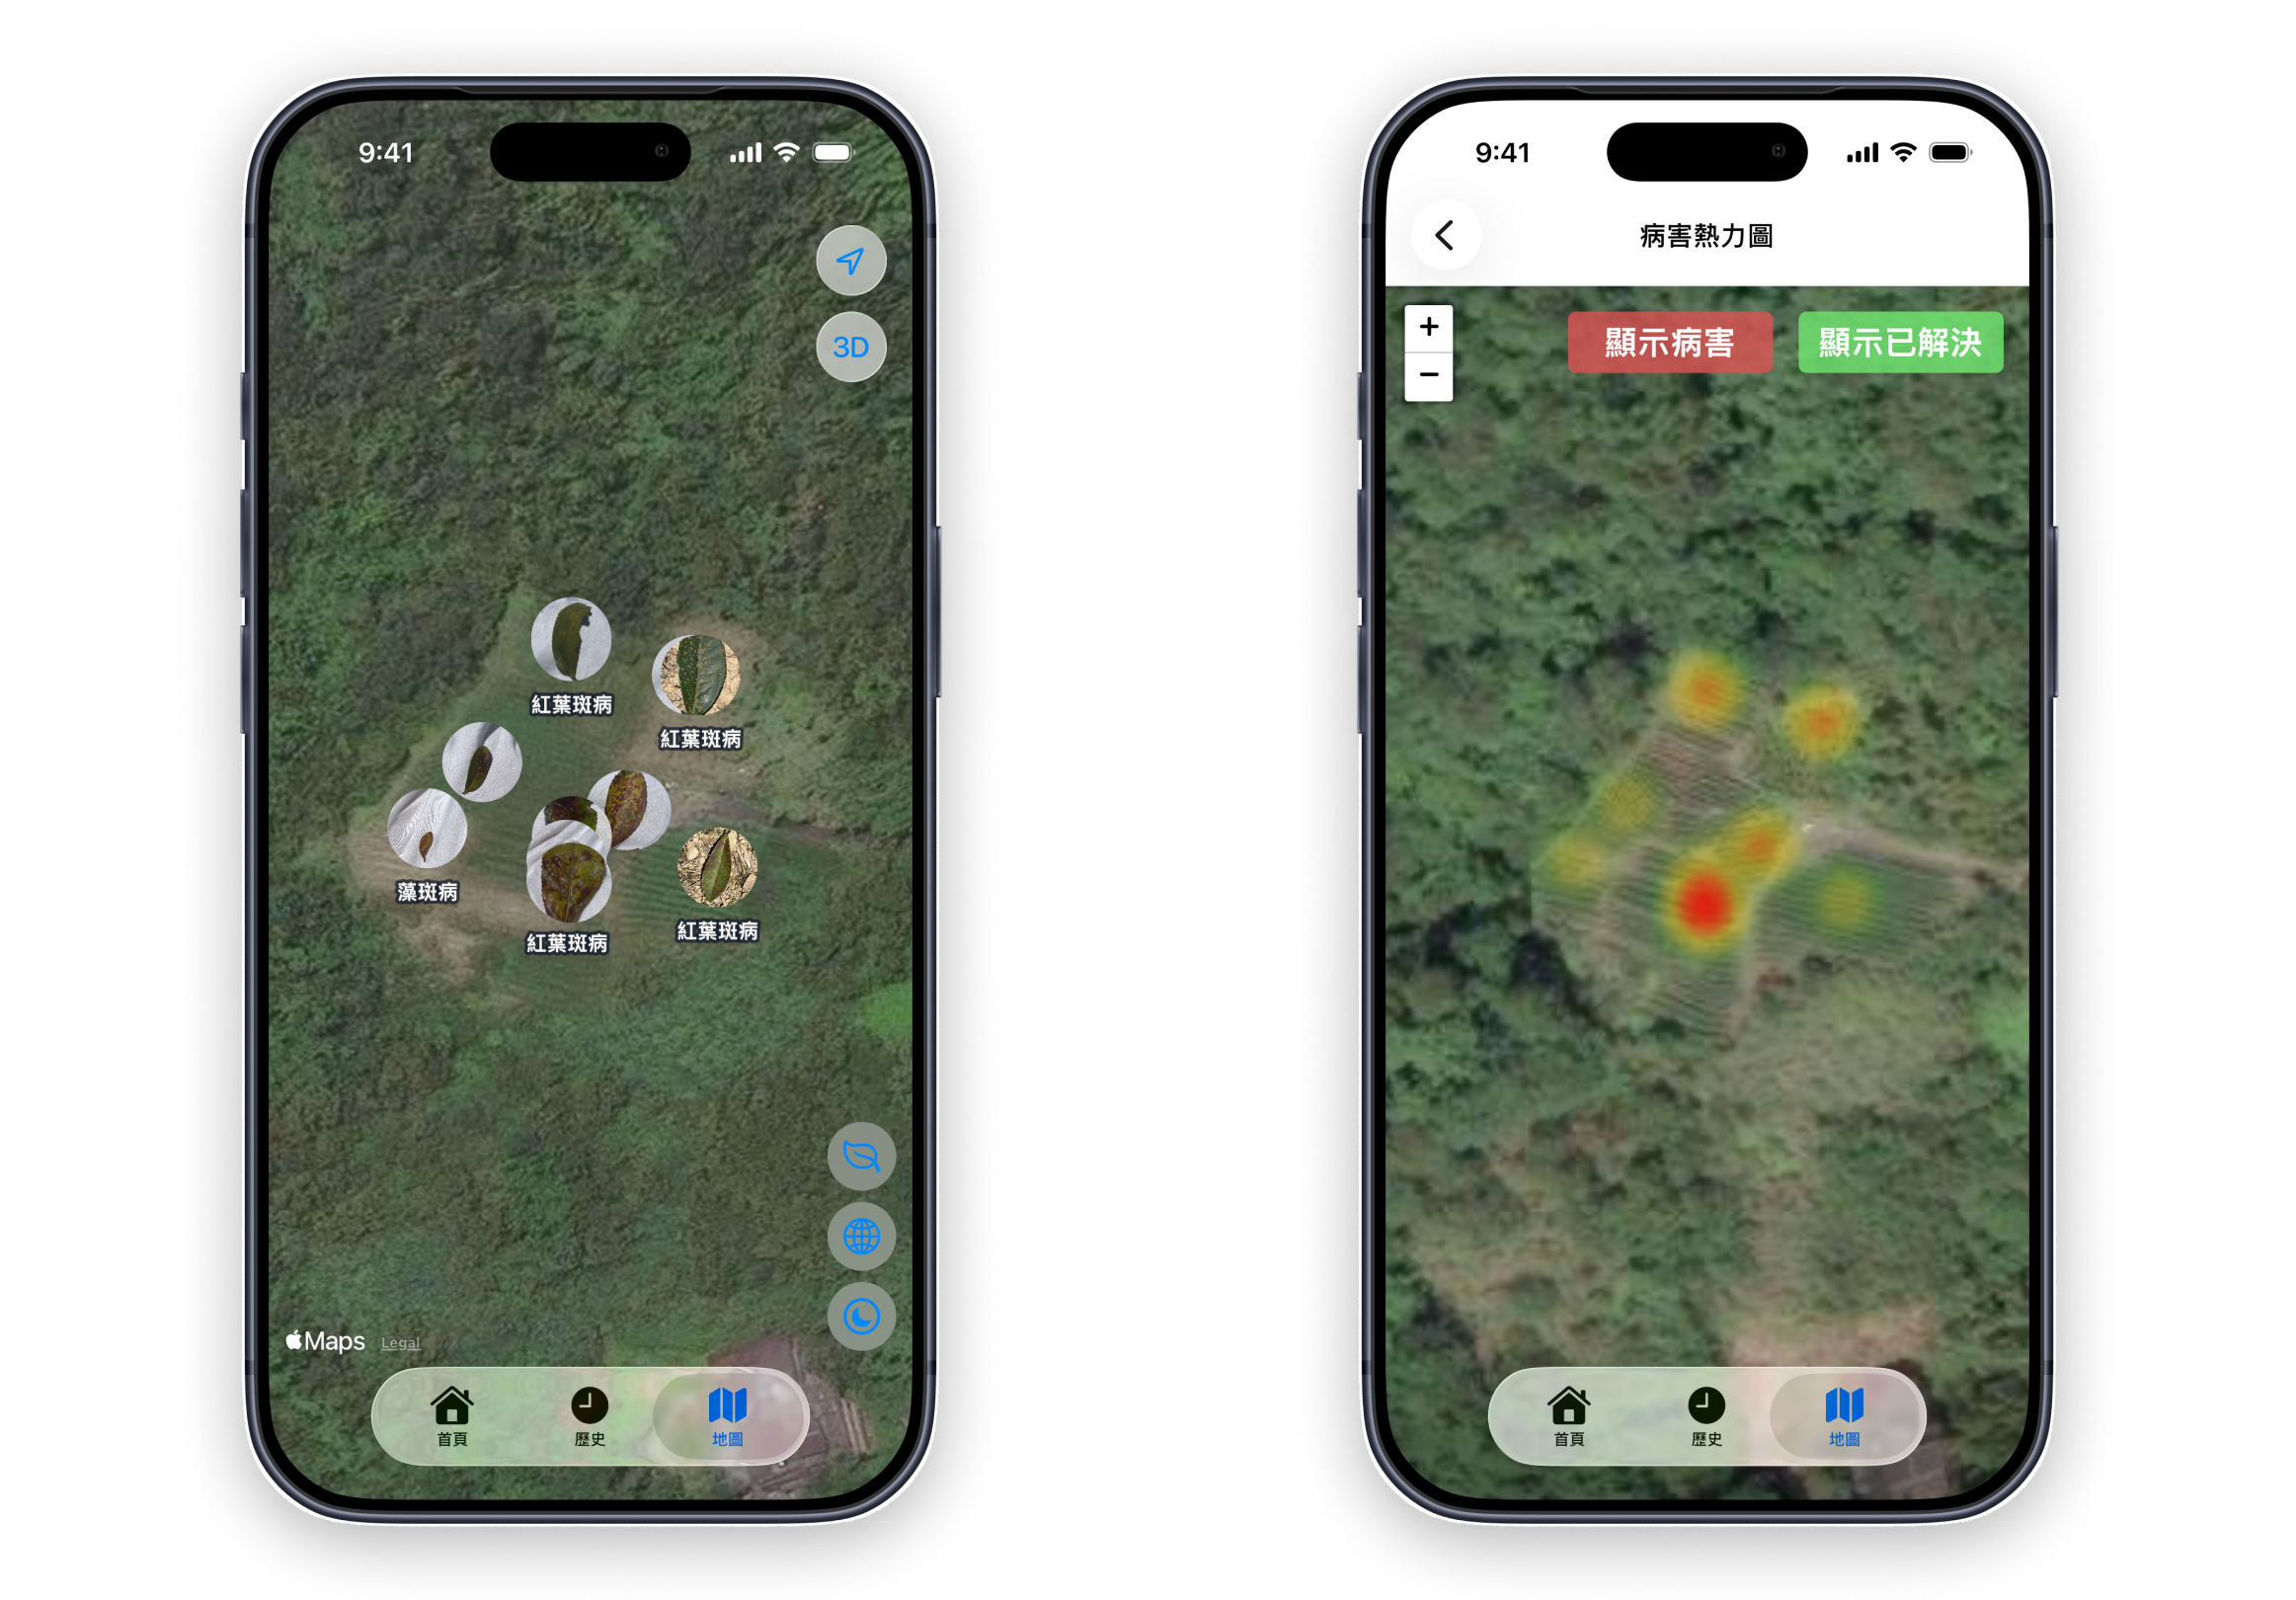
Each disease detection can record the location where the disease occurred, with historical data displayed on a map so tea farmers can view where different diseases have previously appeared. The system also provides a disease heatmap that converts accumulated records into a regional distribution, helping tea farmers observe where diseases have occurred more frequently and how they are distributed across the tea farm.
Tea Farm Growth and Health Report
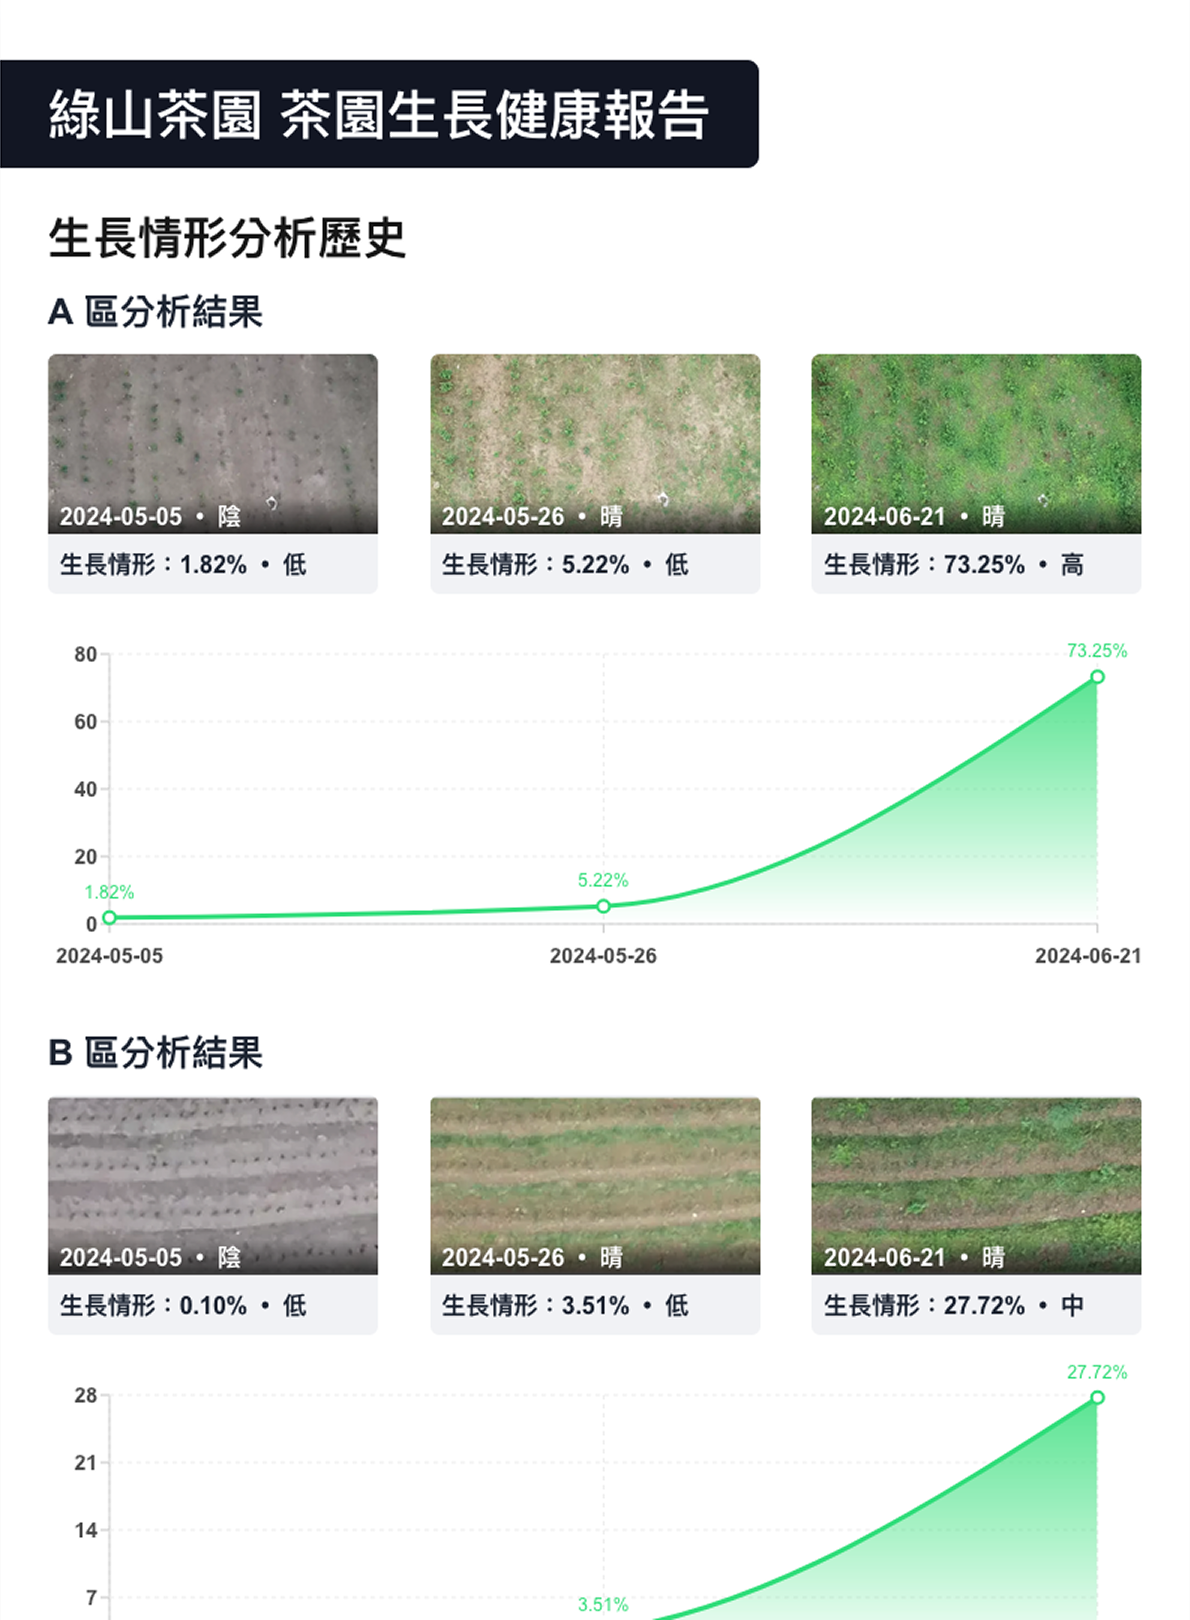
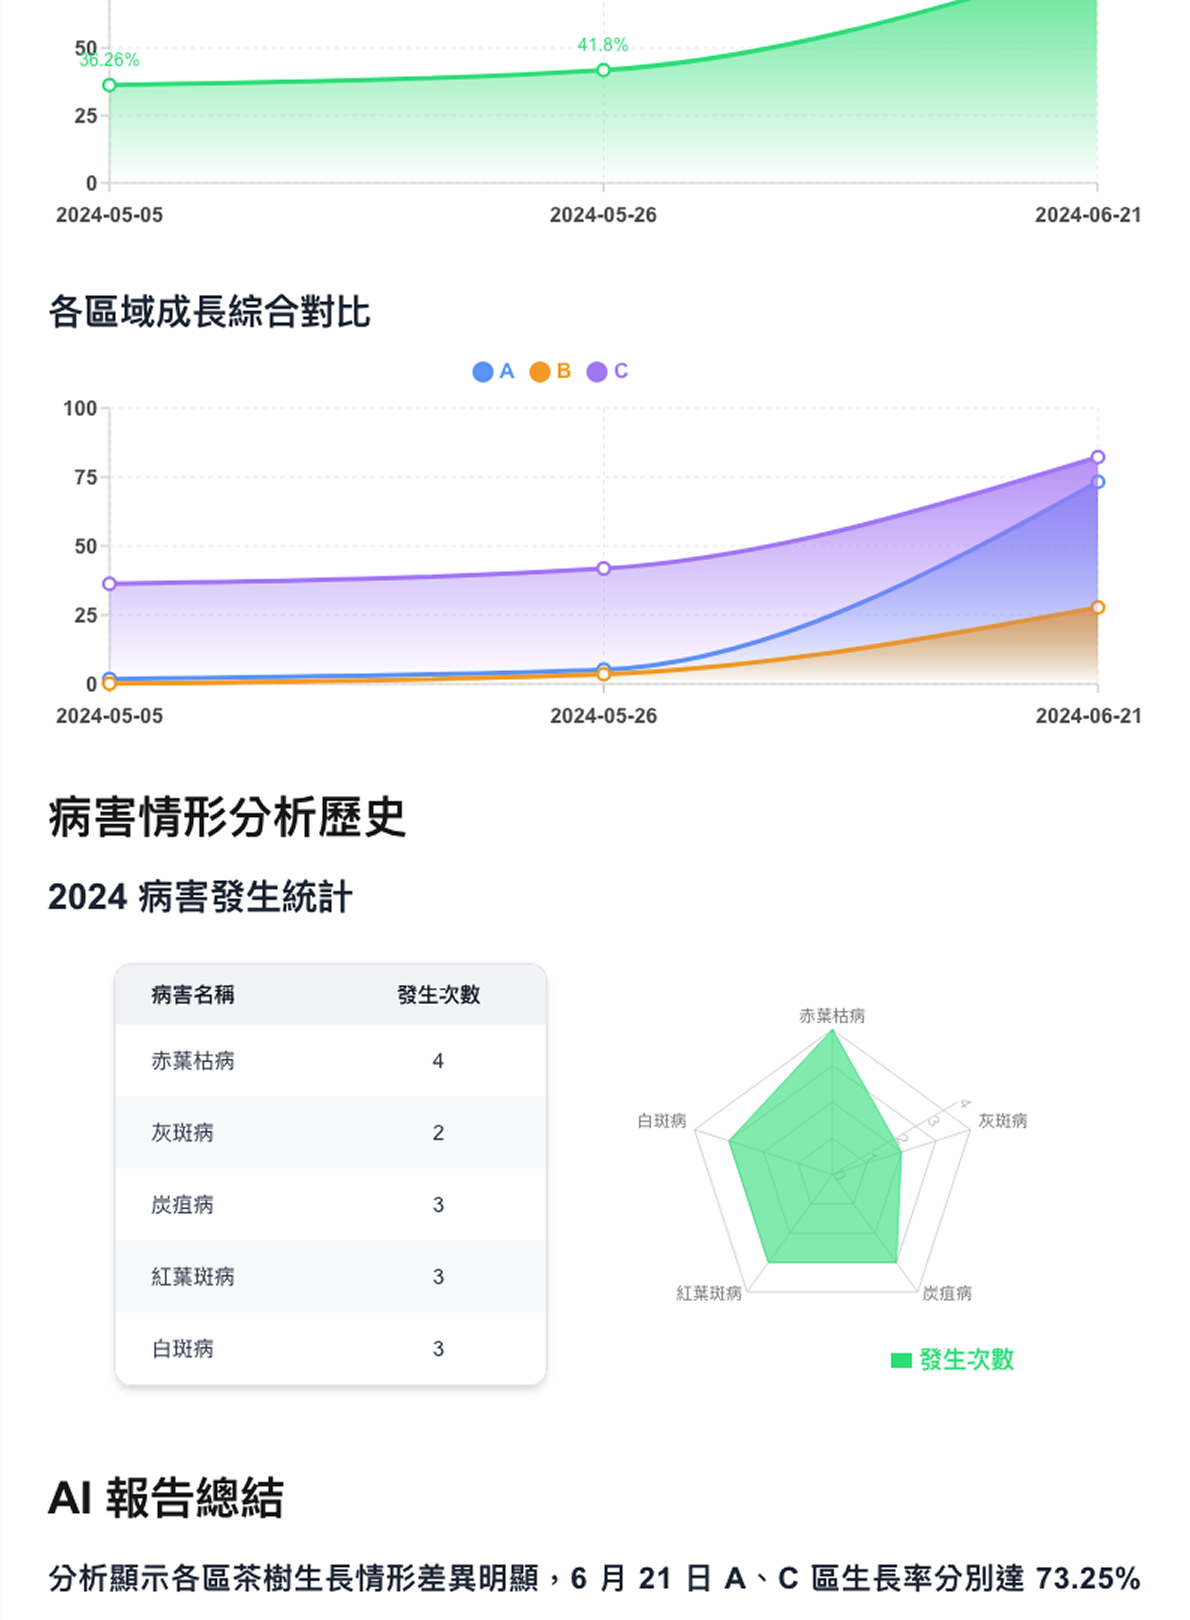
During discussions with tea farmers in the later stages of the project, some farmers expressed a need to compare tea farm conditions across different years and seasons, such as growth rates, disease records, and other farm data from the same season in different years. For instance, during a warmer winter, farmers could compare that winter’s data with data from previous years to observe how differences in climate conditions affected tea plant growth and disease conditions. This could serve as a reference for subsequent farm management and planting adjustments, allowing tea farm management to be based on more historical data.
Therefore, I used Next.js to create an A4-sized tea farm report that organizes tea farm data and disease statistics from different months or years, allowing farmers to compare tea farm conditions and changes over a longer period of time.
The App is expected to provide a one-click export feature. After a tea farmer taps the button, the system will pass the relevant tea farm data to the webpage and automatically generate the corresponding tea farm report.